Time to fill is the number of calendar days from an approved request to an accepted offer. It is the standard measure of how long a role stays open. This guide explains the formula, the 2026 benchmarks and how to reduce it, and it also covers external staff: contractors, consultants and other contingent workers, for whom the clock stops somewhere else.
What is time to fill?
Time to fill is the number of days between the moment a request to fill a role is approved and the moment the offer is accepted. It measures how long a position stays open, and so how long the business goes without the capacity it asked for.
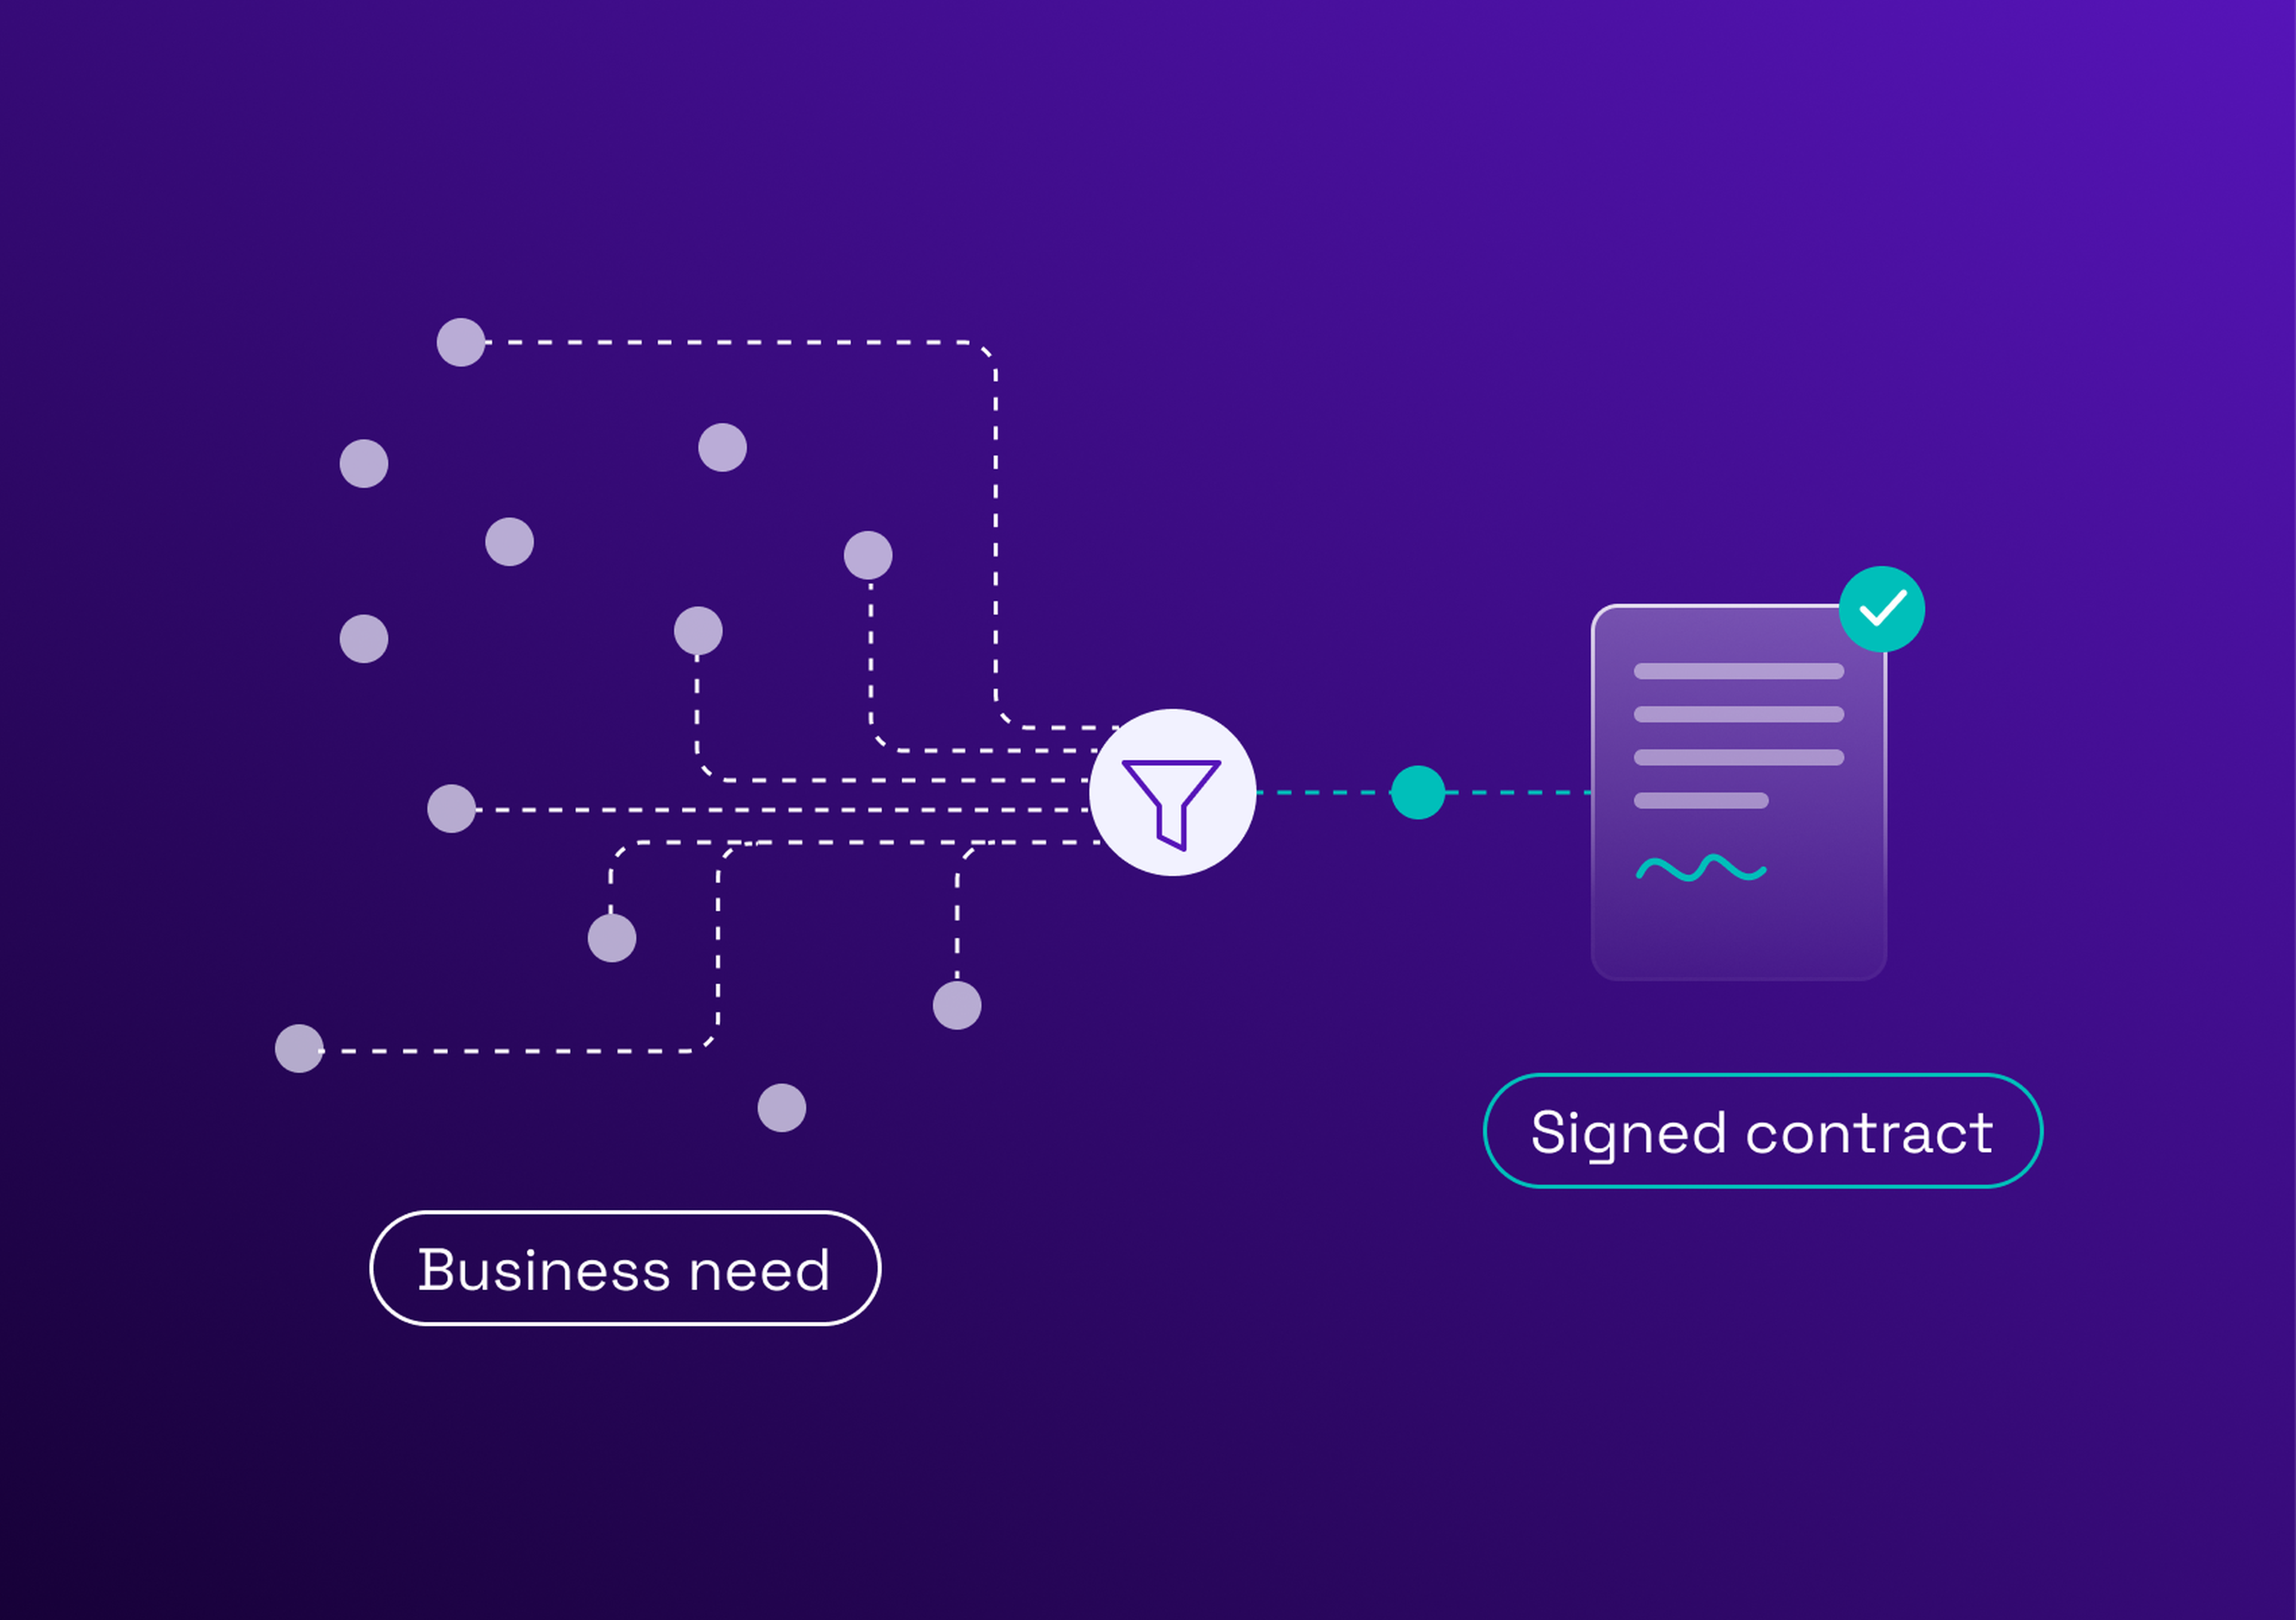
Every day a role stays open is a day of missing capacity: work is delayed, colleagues absorb it, or the business pays for urgency. This is the cost of vacancy: it is hard to price exactly, but it grows with every day the role stays open. The time to fill metric also shows where a hiring or sourcing process is slow, which is why it is a standard KPI.
Start points differ. Some organizations start the clock when the request is opened, others when it is approved. SHRM, for example, counts from the opening of the job requisition. Pick one definition, write it down and keep it: changing it between two reports makes the trend meaningless.
Time to fill formula, with a worked example
The time to fill formula is a subtraction of two dates:
Time to fill = date the offer is accepted − date the request is approved (or opened)
For several roles, the average is:
Average time to fill = total days taken to fill all roles ÷ number of roles filled
Worked example: a request is opened on July 1 and the offer is accepted on August 8. July 1 to August 1 is 31 days, plus 7 days to August 8, which makes 38 days. That is how to calculate time to fill for one role. If three roles were filled in 38, 30 and 46 days, the average is (38 + 30 + 46) ÷ 3 = 38 days.
Averages are sensitive to a single role that stayed open for months. A median, which SHRM uses in its benchmarks, is more robust, and reading both is better than reading one.
Time to fill vs time to hire
Both measures end at the accepted offer, and they start in different places.
| Metric | What it measures | Clock starts | Clock stops | Perspective | Best use |
|---|---|---|---|---|---|
Time to fill | How long a role stays open | The request is approved or opened | The offer is accepted | The business: capacity and planning | Forecasting capacity and judging the whole process |
Time to hire | How long a candidate takes to move through the process | The candidate applies or is first contacted | The offer is accepted | The candidate and the recruiter: experience and efficiency | Improving the candidate journey and screening speed |
Time to fill counts from the need, and time to hire counts from the candidate. A role can have a long time to fill and a short time to hire when the request waits for approval or sourcing starts late. Because it counts from the need, time to fill is the measure that matters to a buyer.
What is a good time to fill? Benchmarks to use with care
The average time to fill published today describes permanent hiring, not contractors. The reference figures come from SHRM's 2026 recruiting benchmarking.
| Benchmark | Value | Source and year |
|---|---|---|
Median time to fill, nonexecutive positions | 39 calendar days | SHRM Recruiting Executives Benchmarking, 2026 |
Median time to fill, nonexecutive positions | 44 days | SHRM, 2025 |
Median time to fill, executive positions | 45 days | SHRM, 2026, unchanged from 2025 |
These figures describe permanent hiring. We found no authoritative benchmark for contractor roles, so any threshold quoted for them should be read as a vendor's own figure, not as a standard. The safer approach is to build your own baseline by type of role, and to compare it with itself over time.
How time to fill works for contractors and external services
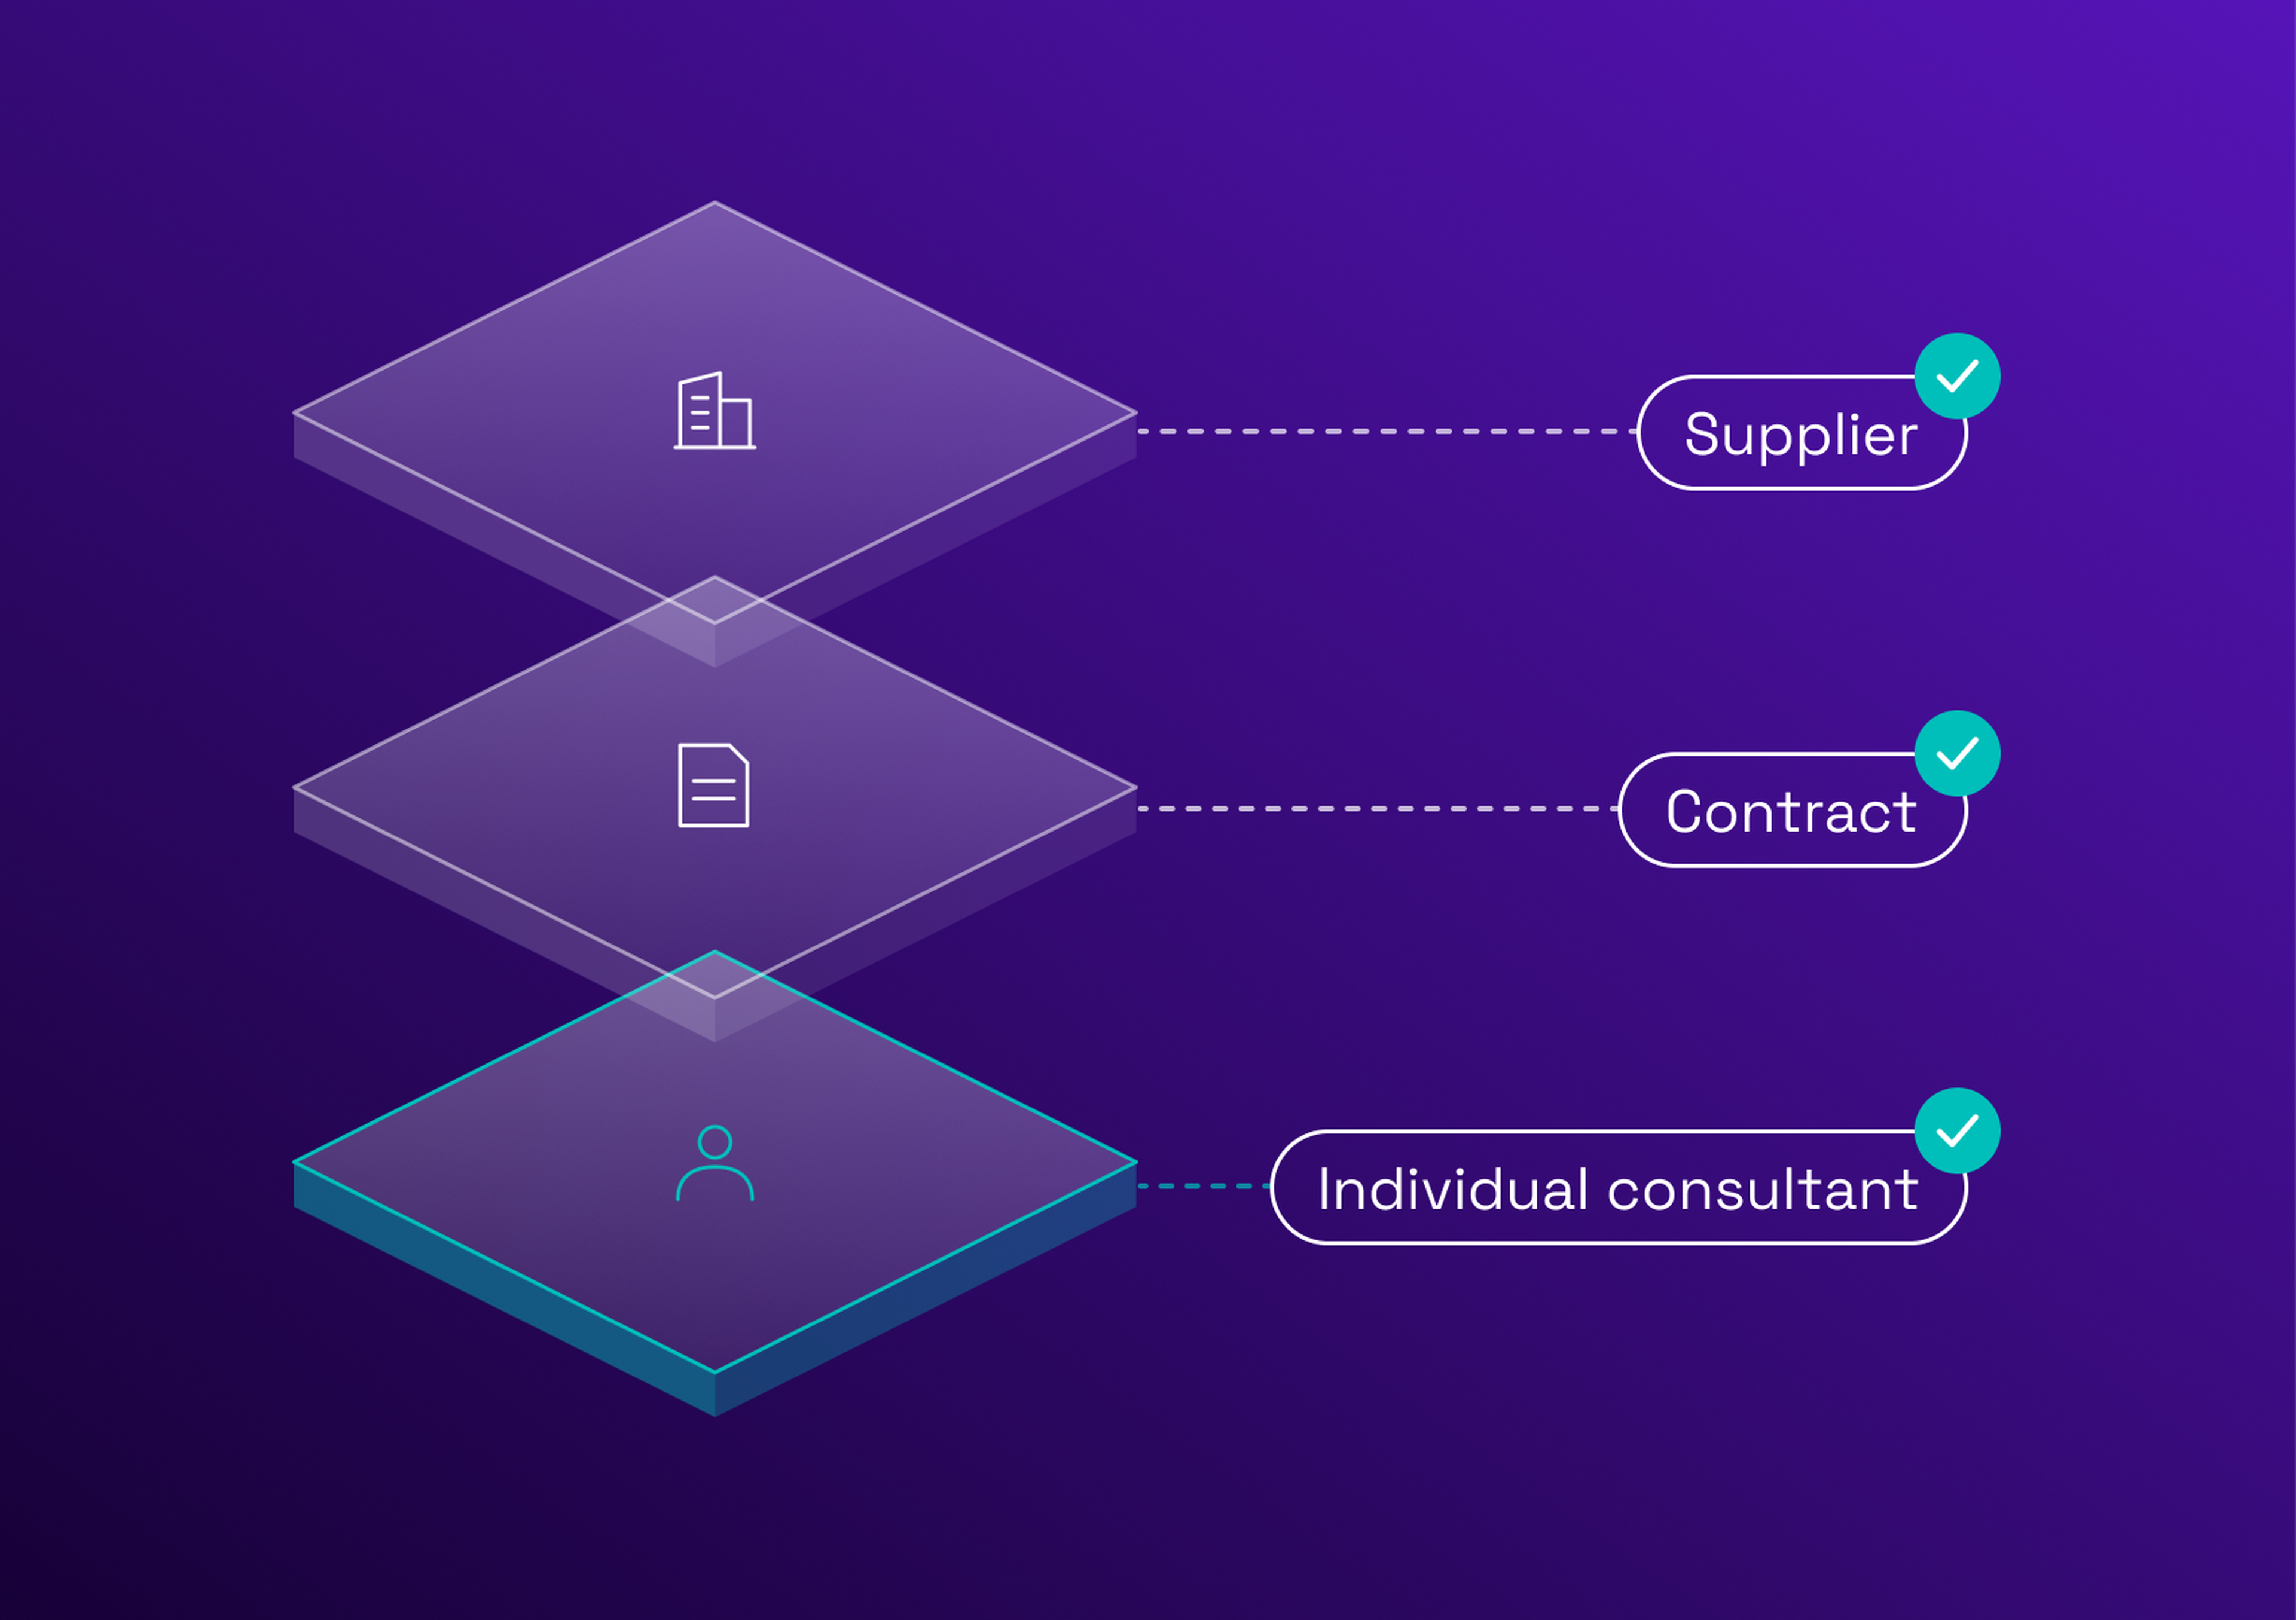
For a contingent worker or a consultant, a role does not move through an offer and its acceptance. It moves through a request, an RFQ (request for quotation) sent to suppliers, supplier profiles, a selection, a purchase order and a start date. The HR definition has no equivalent of "offer accepted", so contractor time to fill needs its own definition.
Where the clock starts and stops
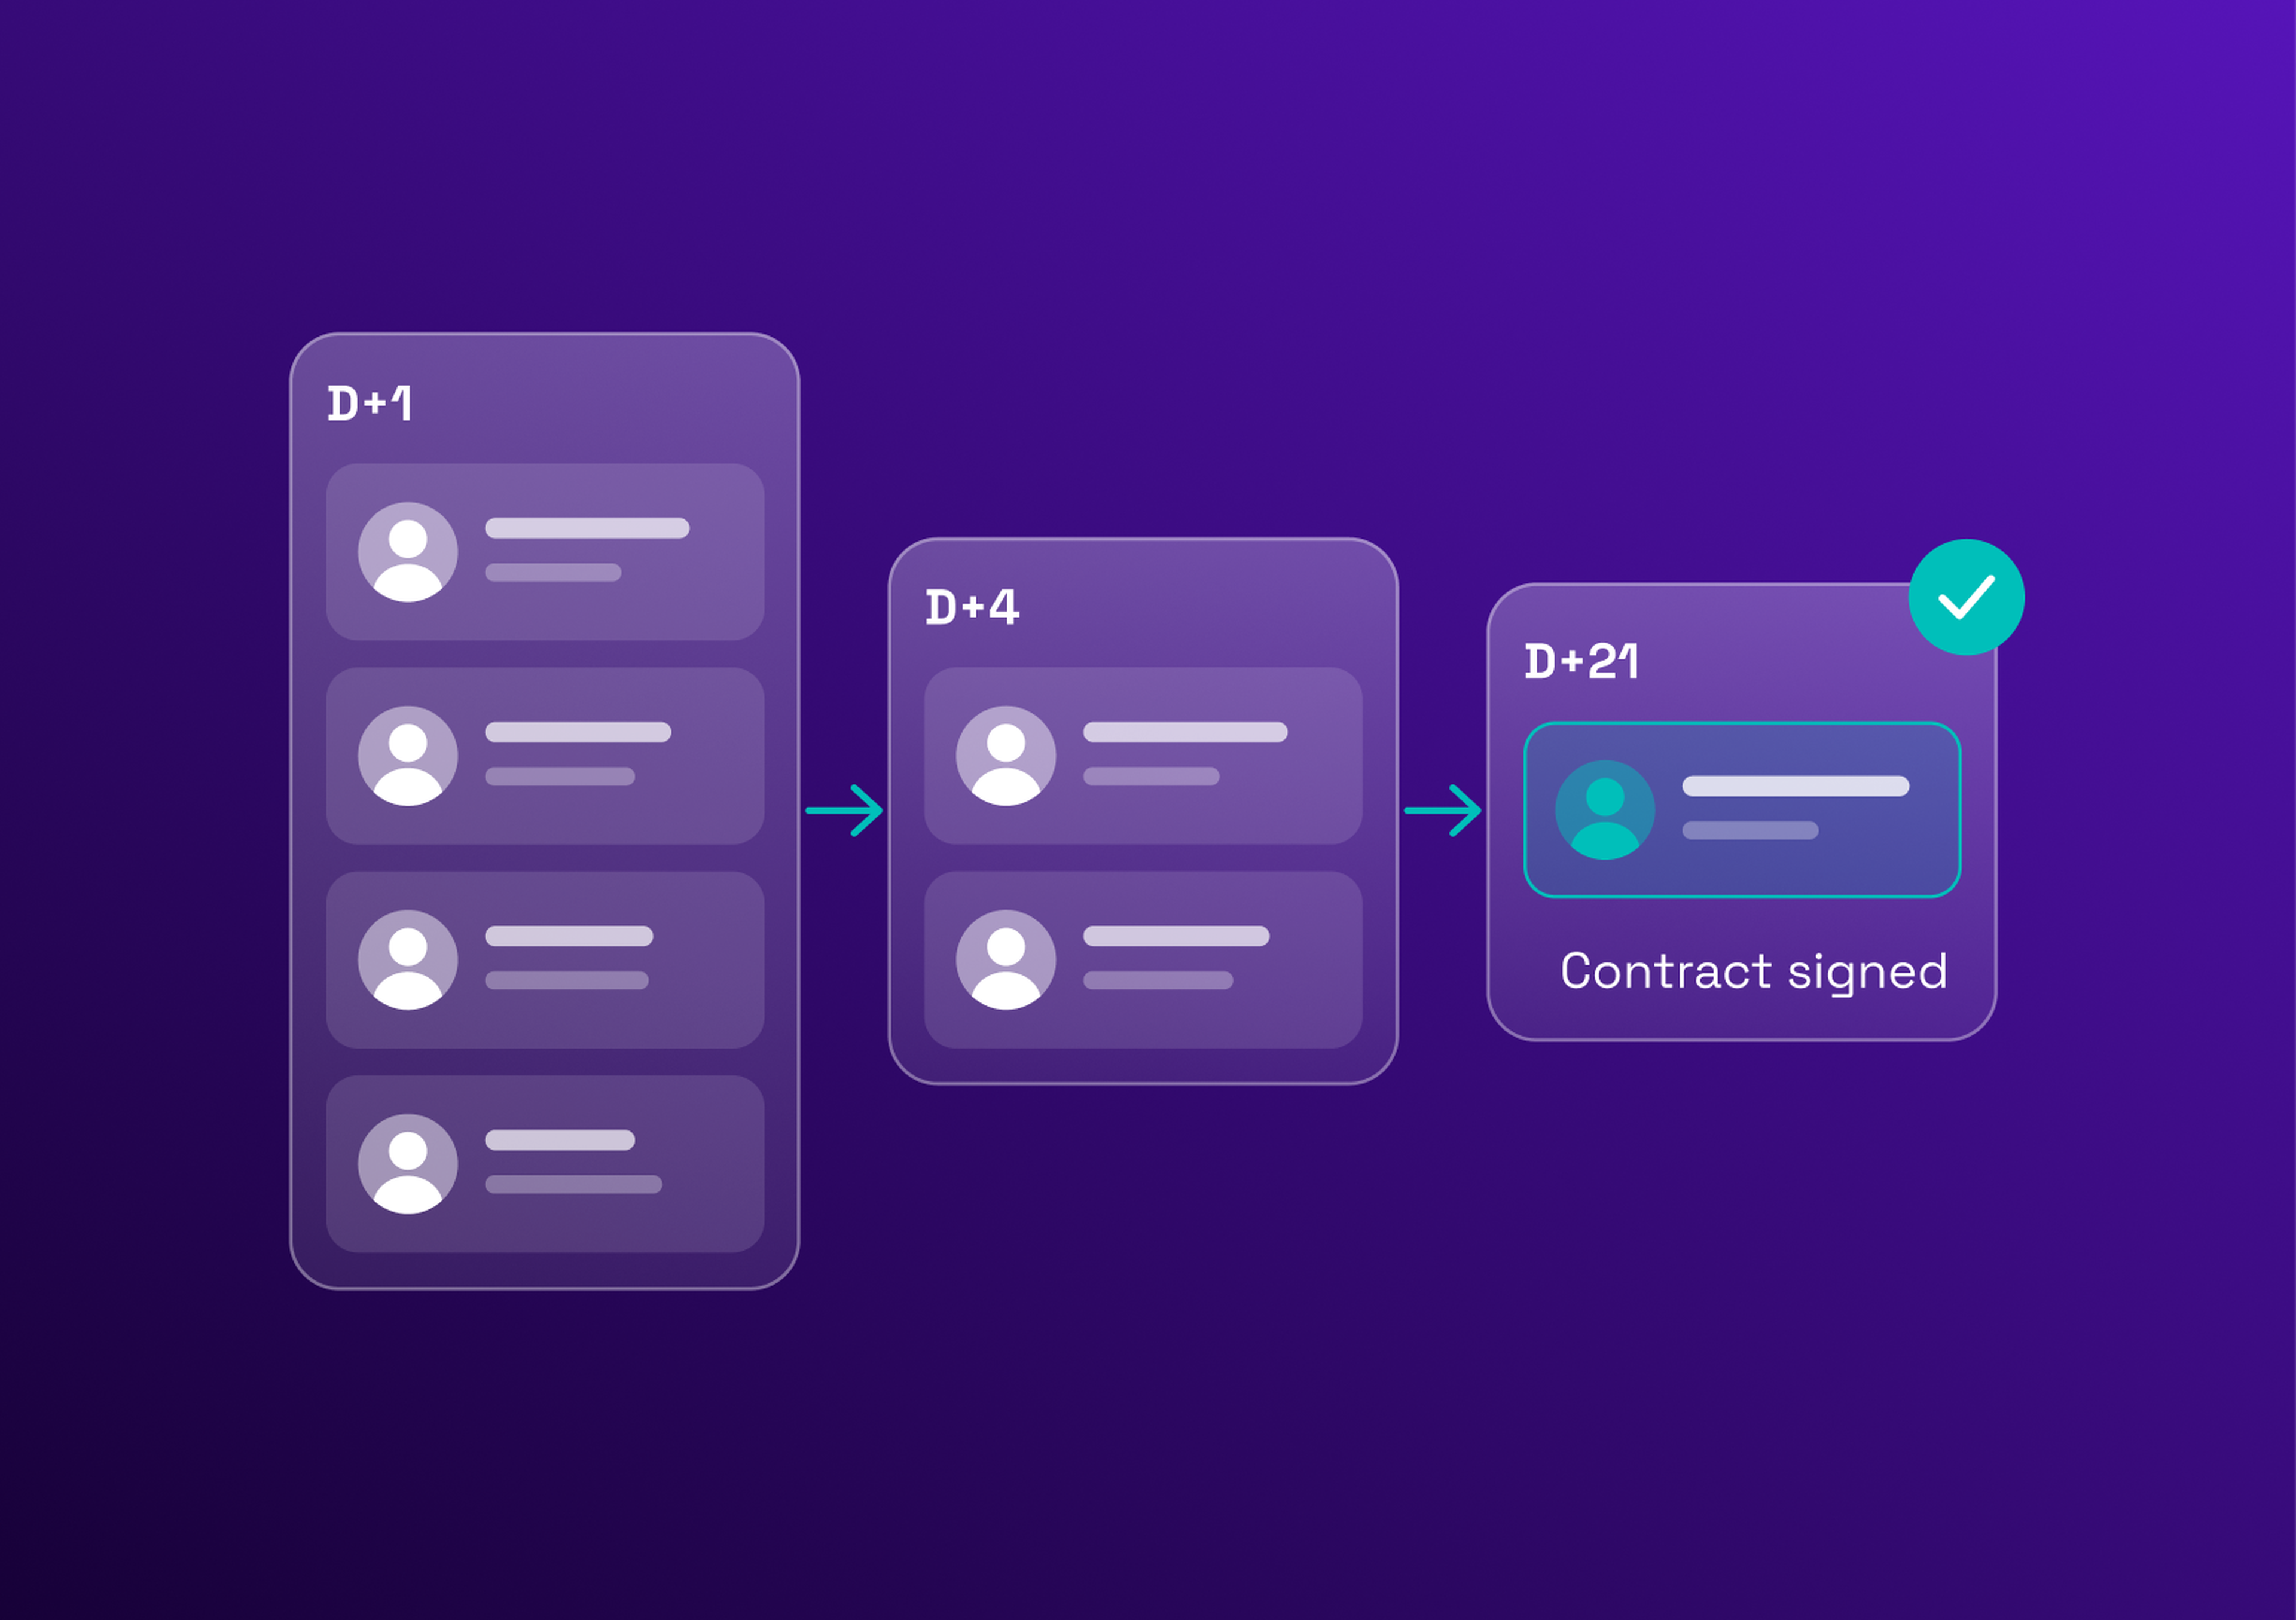
We recommend measuring time to fill for a contractor from the approved request to the signed purchase order or contract, and tracking the start date separately. This is an editorial recommendation, not a standard. The PO is the moment the business commits to a supplier and a profile, and it is the last step the procurement process controls. The start date also depends on the consultant's notice period and on access to systems.
The four numbers to track
One number is not enough to find where the time goes. Four numbers do the job:
| Metric | Clock runs from → to | Example dates | Days |
|---|---|---|---|
Time to first profile | Request approved → first supplier profile | Mar 2 → Mar 9 | 7 |
RFQ-to-PO time | RFQ published → PO created | Mar 4 → Mar 23 | 19 |
Time to fill | Request approved → PO created | Mar 2 → Mar 23 | 21 |
Time to start | Request approved → worker starts | Mar 2 → Apr 6 | 35 |
The dates are illustrative. Time to fill contains the first profile and most of the RFQ-to-PO time. Time to start goes further, up to the worker's first day. For a contractor, time to fill defined this way is the number the buyer can act on, and the three others tell where the delay sits.
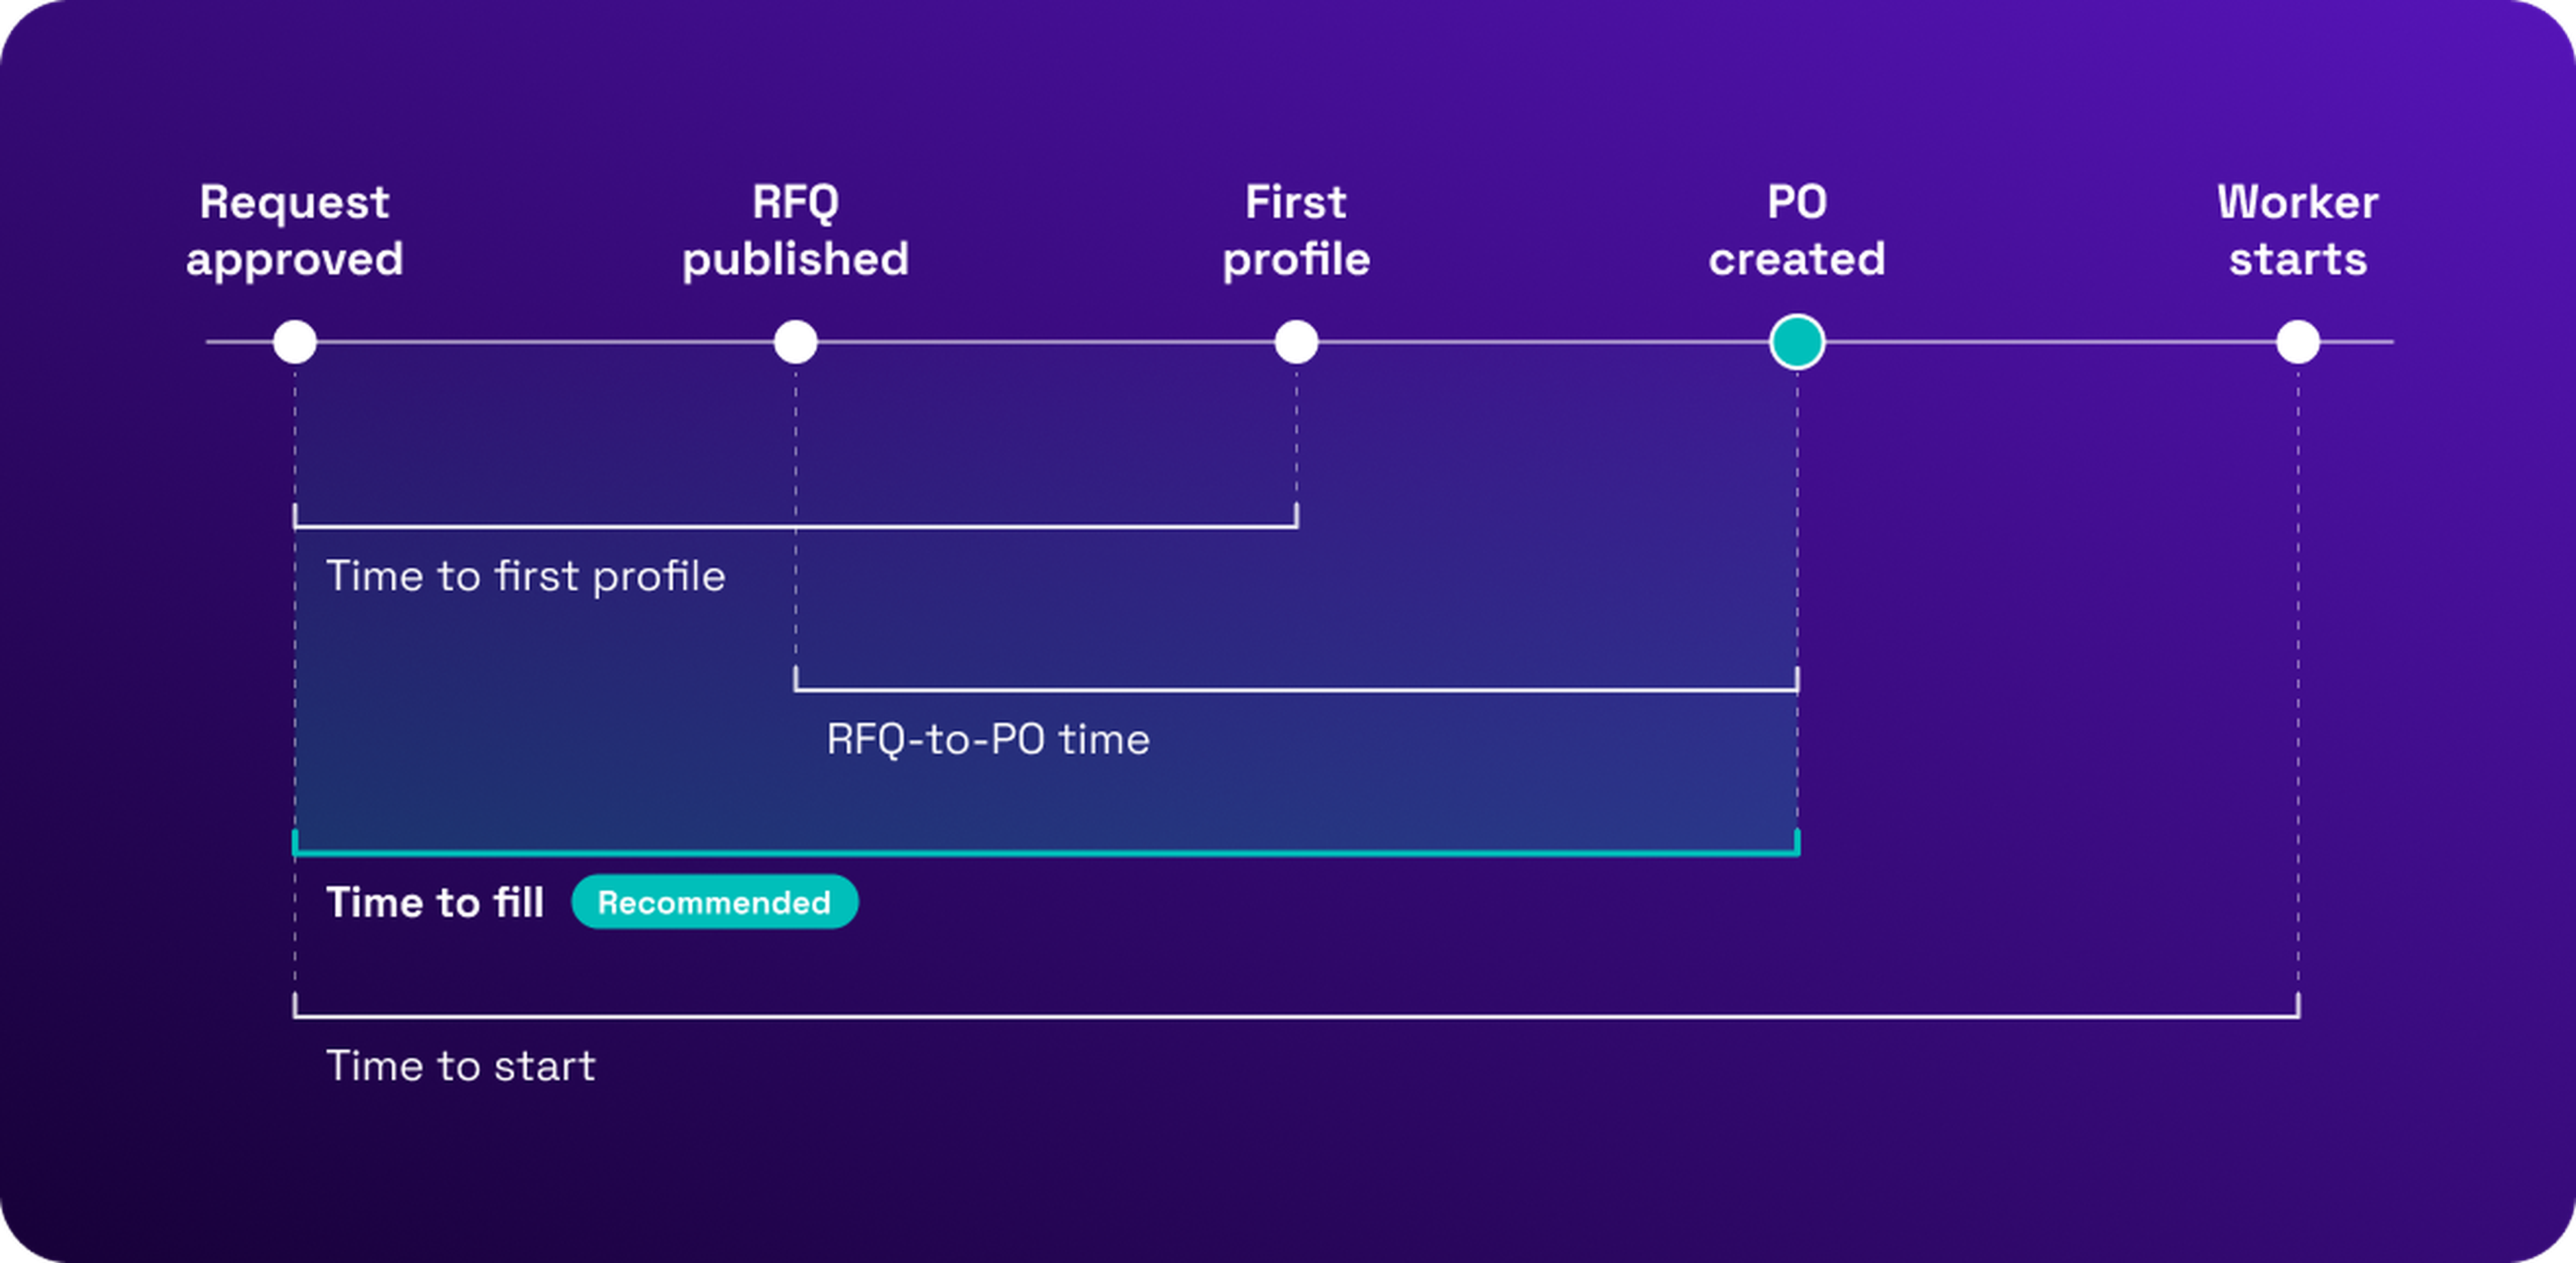
The four numbers become more useful when they are read by supplier. The table below uses illustrative figures for three suppliers on the same panel.
| Supplier | Requests received | Median time to first profile | Median time to fill | Fill rate |
|---|---|---|---|---|
Supplier A | 12 | 3 days | 18 days | 75% |
Supplier B | 10 | 8 days | 27 days | 60% |
Supplier C | 6 | 4 days | 20 days | 83% |
Supplier B is the slowest to answer and the least likely to place a profile, so its requests are the first candidates for a review. Supplier C is fast and fills most requests, but on a small volume. Reading by supplier turns a metric into a panel decision: who receives the next request, who gets a conversation and who leaves the list.
What slows time to fill down, stage by stage
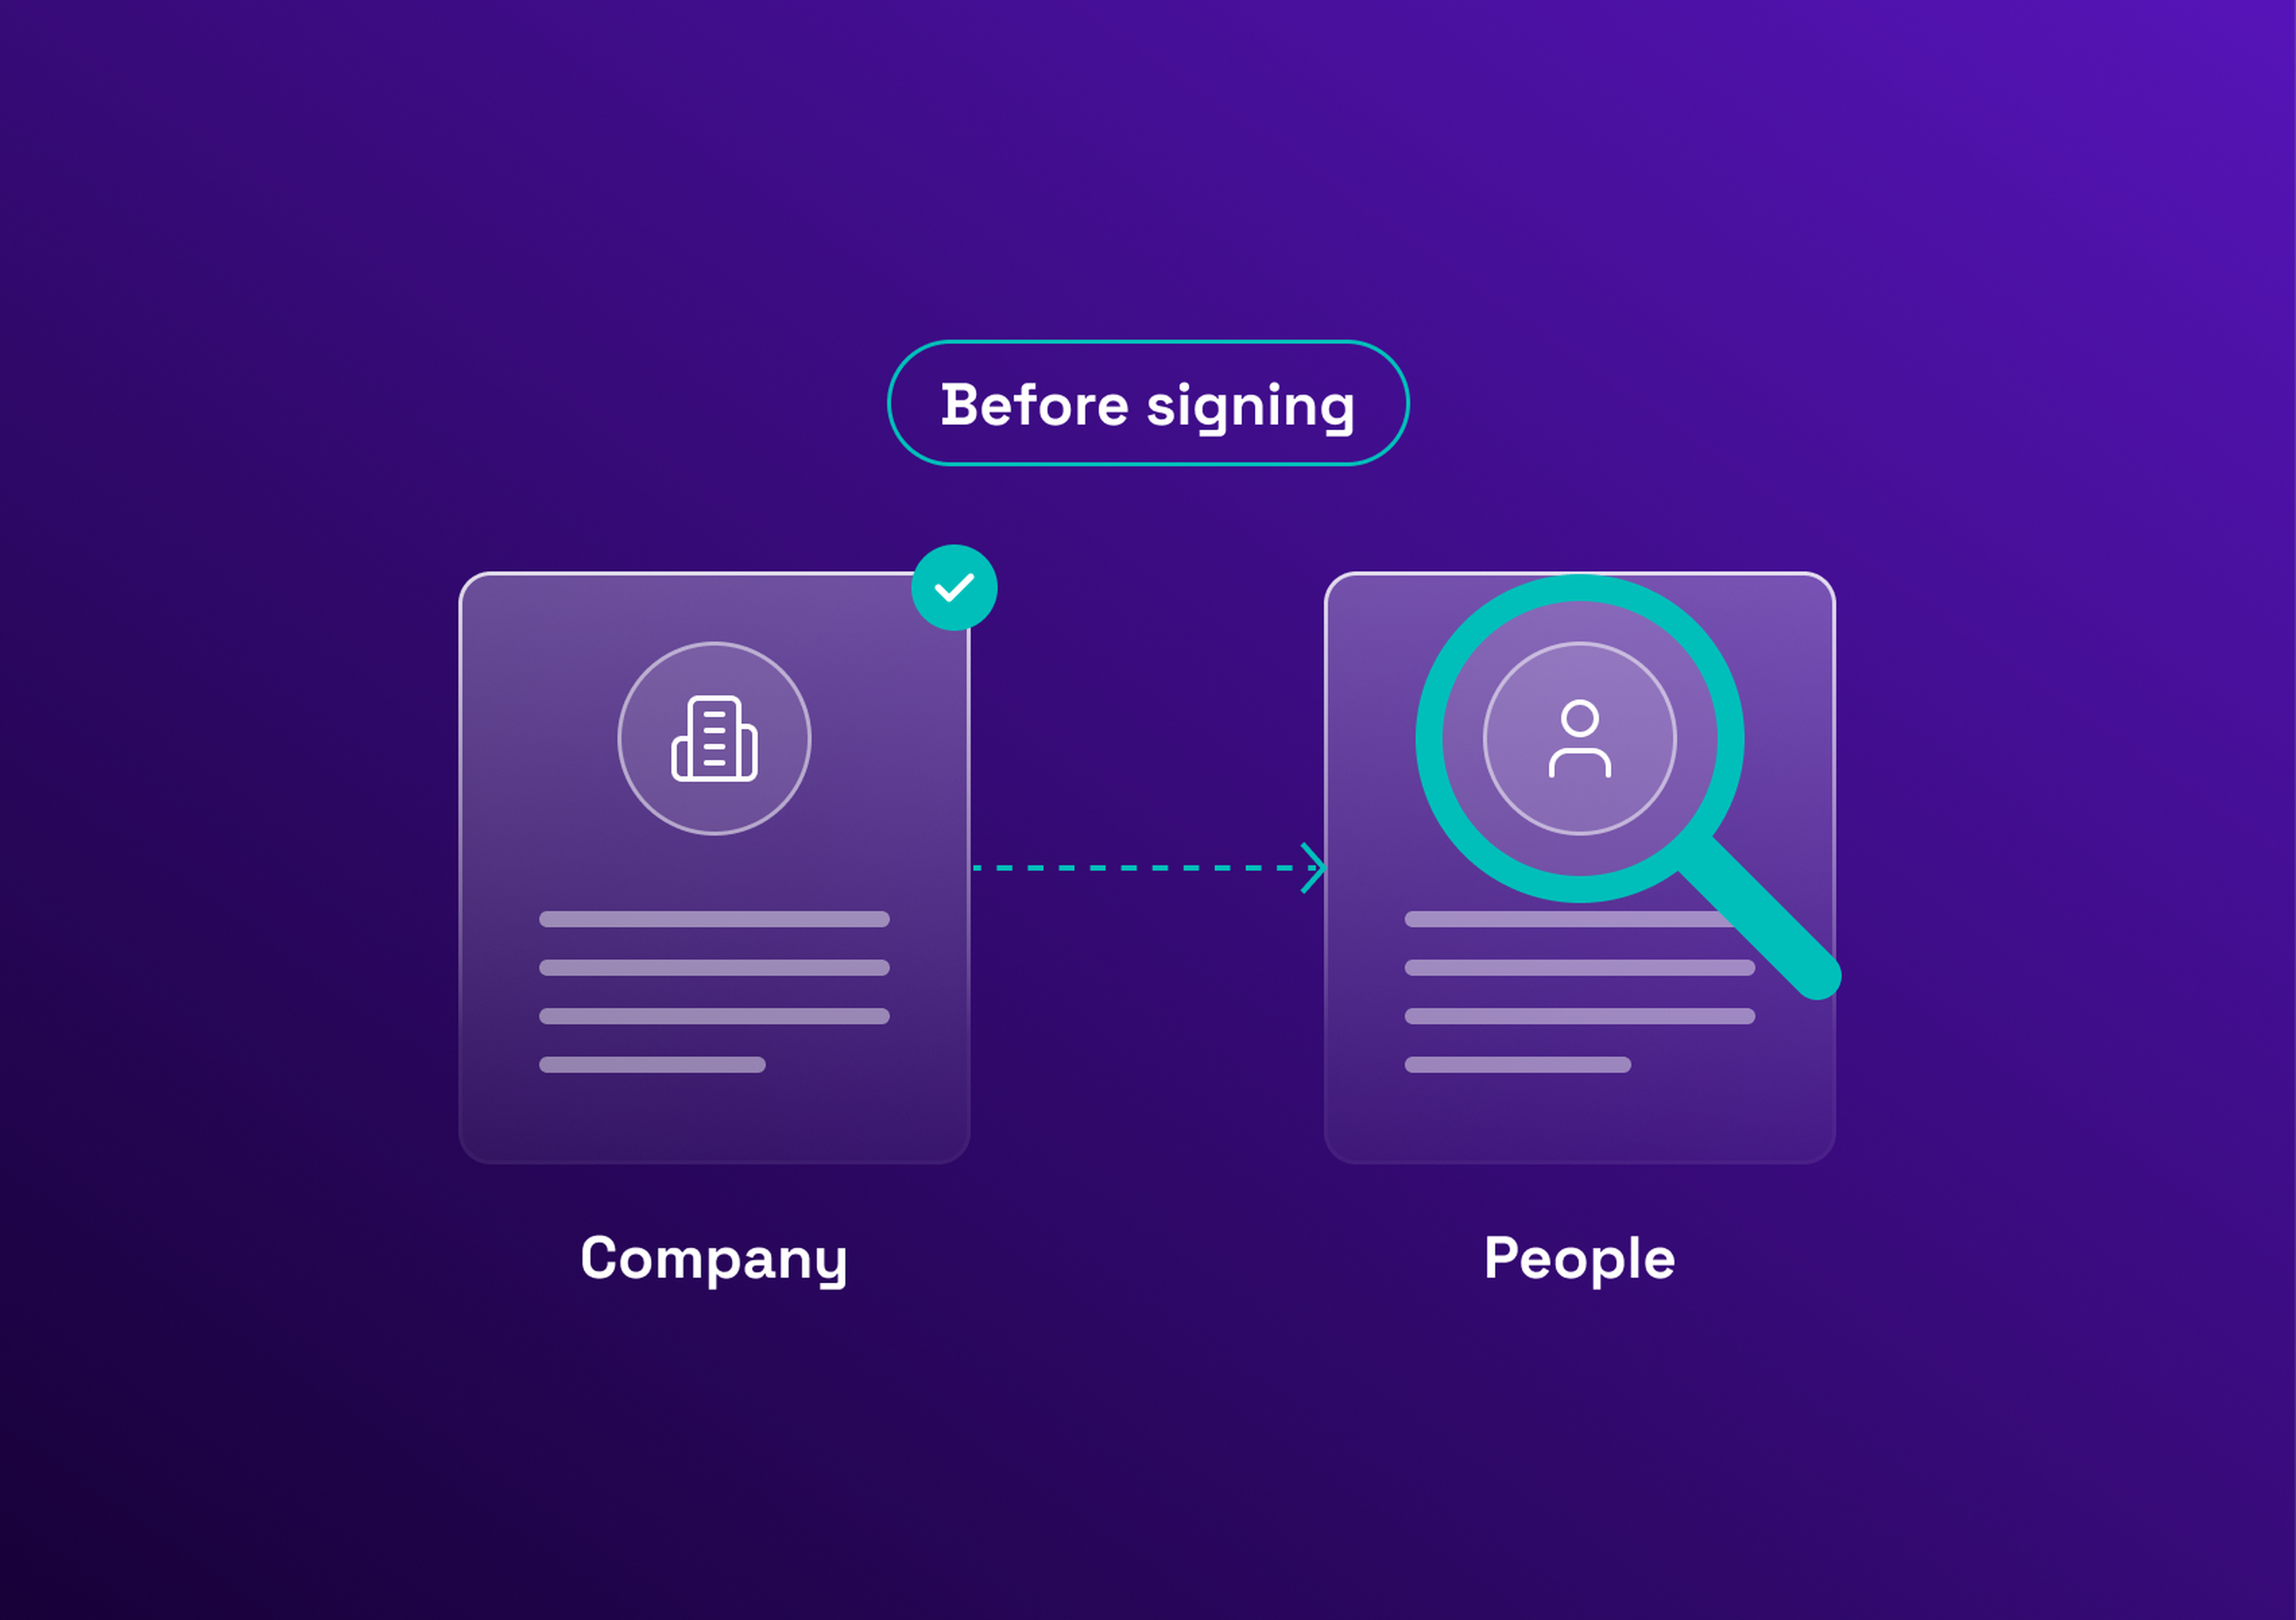
The delay rarely sits where people expect. A request that crosses a heavy approval workflow loses days before any supplier sees it, and a request sent to suppliers outside the supplier panel gets fewer and slower responses.
| Stage | Typical cause | The number that reveals it |
|---|---|---|
Request approval | Too many approvers, or an unclear budget owner | Days from request submitted to request approved |
RFQ scoping | An incomplete request that is sent back for clarification | Share of requests returned, and days from approval to RFQ published |
Supplier response | Suppliers outside the panel, or little interest in the request | Time to first profile, and profiles received per request |
Business selection | Managers slow to review profiles | Days from the last profile to the selection |
Contract or compliance checks | Missing documents, or a rate to negotiate | Days from selection to PO created |
How to reduce time to fill without hurting quality
Five actions reduce time to fill without lowering the quality of what is bought:
Standardise the request. One template with the role, the seniority, the location, the dates, the budget and the must-have skills keeps the RFQ from coming back for clarification.
Maintain a ranked supplier list instead of ad-hoc outreach. Suppliers that are already qualified and ranked by past performance receive requests first, which shortens the stage before the first profile. See dynamic supplier listing.
Use rate cards to shorten negotiation. Agreed day rates by profile remove a rate negotiation from every request.
Set a business decision deadline. Managers get a fixed number of days to select after the profiles arrive, because profiles go stale fast.
Review results by supplier. Read the four numbers for each supplier and feed them into panel decisions, with the supplier performance KPIs already in place.
Speed alone should not be rewarded. Read time to fill next to the fill rate, the share of requests that end in a placement, and next to supplier performance. A supplier that answers fast with weak profiles should not look like the best one. The wider procurement KPIs give the context, and the guide to managing a contingent workforce covers the rest of the process. For the RFQ stage itself, see how to write an RFP for services.
Common time to fill mistakes
Changing the start date between reports, so the trend compares two different things.
Averaging all role types together, so a few slow roles hide the real picture.
Comparing contractor numbers with permanent benchmarks, which measure another process.
Ignoring cancelled requests, which makes the figures look better than they are.
Tracking time to fill in a VMS
A vendor management system is a natural place to measure time to fill, because the request, the RFQ, the supplier responses and the purchase order live in the same tool. Eleven VMS offers RFQs and rate cards, a dynamic supplier listing, dashboards and a reporting module, which are the pieces this metric relies on.
Book a meeting with one of our experts for a personalized demo.